
UBIK Capital Node Monitoring and Alerting Strategy
1. Introduction
With decentralization of the ICON Mainnet drawing near, it is imperative that node operators setup proper monitoring and alerting systems to ensure they can maintain node uptime. This keeps the ICON network secure, efficient, and avoids penalties. This article presents UBIK Capital’s monitoring and alerting system strategy. We hope the methods we use can be utilized by other teams that don’t yet have a similar system in place. Having a monitoring and alerting system is vital for any P-Rep team. These systems enable teams to quickly learn of and fix any node issues. Such a system can help ICONists vote with confidence, knowing the P-Reps they have allocated their votes too, are actively monitoring their node.
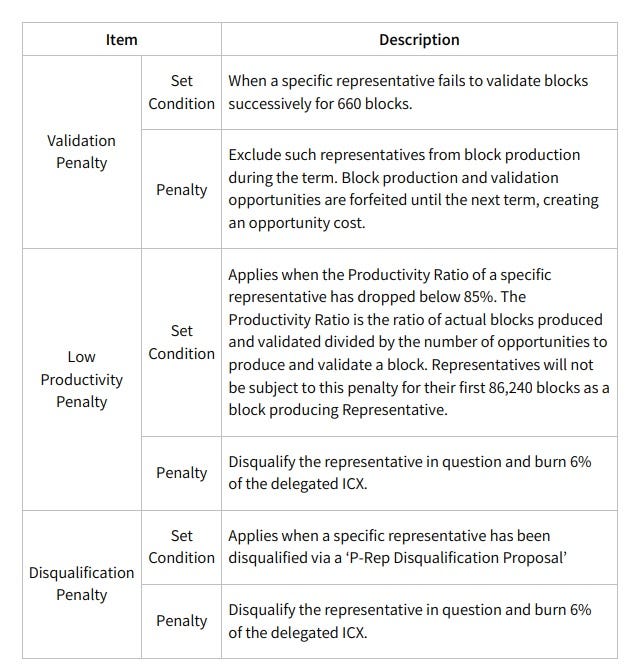
One concern to ICONists is a 6% penalty for low productivity. A proper monitoring system can quickly identify failures, ensuring higher uptime and reducing the risk of such a penalty.
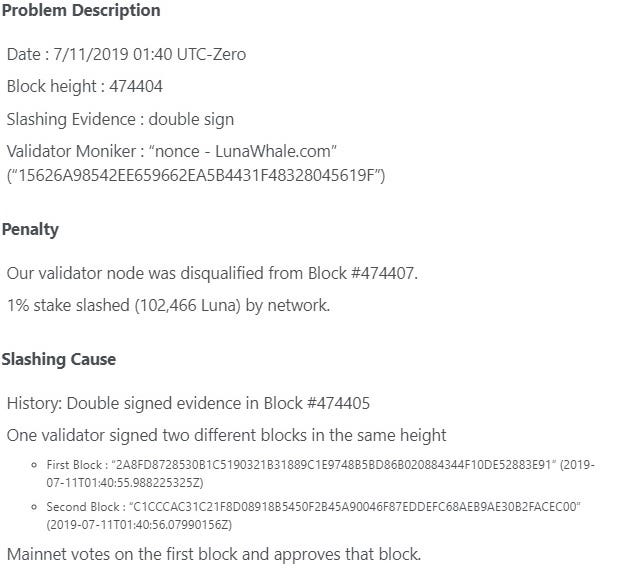
Similar penalties have occurred in other networks. One such example occurred in the Terra Network, with a value of over $100,000 at that time. We want all P-Reps to work hard to ensure these types of penalties do not occur, so we can keep the ICON network running smoothly, and subsequently increase the value of the ICON network over time.
2. Overview of the tools UBIK Capital is using for monitoring and alerts
Prometheus is an open-source system monitoring and alerting toolkit. Prometheus offers multi-dimensional data collection and querying. Prometheus will be used as a data source for Grafana.
2.Grafana
Grafana is an open-source metric analytics & visualization suite. It is most commonly used for visualizing time series data for infrastructure and application analytics. Grafana allows querying and visualization of critical data to help understand our node’s behavior. We use Grafana as the visualization tool with Prometheus as a data source.
3.CAdvisor
CAdvisor is a running daemon that collects, aggregates, processes, and exports information about running containers, such as the Docker container used in our ICON node operations.
4.Node Exporter for Prometheus
Node Exporter exposes a wide variety of hardware and kernel related metrics.
3. How to install and use the monitoring and alert system
We use a system running Ubuntu 18.04. We recommend using a separate system for your node and for monitoring tools. Ensure both systems can communicate via the following ports: 3000, 8080, 9090, 9100.
Step 1. Install Docker
$ sudo apt-get update
$ sudo apt-get install  -y systemd apt-transport-https ca-certificates curl gnupg-agent software-properties-common
$ curl -fsSL https://download.docker.com/linux/ubuntu/gpg | sudo apt-key add -
$ add-apt-repository "deb [arch=amd64] https://download.docker.com/linux/ubuntu $(lsb_release -cs) stable"
$ sudo apt-get update
$ sudo apt-get -y install docker-ce docker-ce-cli containerd.io
$ sudo usermod -aG docker $(whoami)
$ sudo systemctl enable docker.service
$ sudo systemctl start docker.service
$ docker version
Step 2. Install Docker-Compose
$ sudo apt-get install -y python-pip
$ sudo pip install docker-compose
$ docker-compose version
Step 3. Create a new folder named iconmonitoring
$mkdir iconmonitoring$cd iconmonitoring/
Step 4. Create a new file inside the folder, named docker_iconmonitoring.yml with the following content and change your_linux_username and your_password
version: '3'
services:
  prometheus:
    image: prom/prometheus:latest
    volumes:
      - ./prometheus.yml:/etc/prometheus/prometheus.yml
      - ./prometheus_db:/var/lib/prometheus
    command:
      - '--config.file=/etc/prometheus/prometheus.yml'
    ports:
      - '9090:9090'
    depends_on:
      - cadvisor
node-exporter:
    image: prom/node-exporter
    ports:
      - '9100:9100'
grafana:
    image: grafana/grafana:latest
    user: "your_linux_username"
    environment:
      - GF_SECURITY_ADMIN_PASSWORD=your_password
    volumes:
      - ./grafana_db:/var/lib/grafana
    depends_on:
      - prometheus
    ports:
      - '3000:3000'
    networks:
      - default
cadvisor:
    image: google/cadvisor:latest
    ports:
      - '8080:8080'
    volumes:
      - /:/rootfs:ro
      - /var/run:/var/run:rw
      - /sys:/sys:ro
      - /var/lib/docker/:/var/lib/docker:ro
Step 5. Create a new file inside the folder named prometheus.yml with the following content and change YOUR_IP
global:
  scrape_interval: 5s
  external_labels:
    monitor: 'icon-monitor'
scrape_configs:
  - job_name: 'prometheus'
    static_configs:
      - targets: ['YOUR_IP:9090']
  - job_name: 'node-exporter'
    static_configs:
      - targets: ['YOUR_IP:9100']
  - job_name: 'cAdvisor'
    static_configs:
      - targets: ['YOUR_IP:8080']
Step 6. Run Docker-Compose
$ docker-compose -f docker_iconmonitoring.yml up -dGreat! Now, let’s check if all the docker images are running, you should see a list with all 3 docker images.
$ docker psIf you want to close all the docker images that are running
$ docker-compose -f docker-compose-mon.yml downFor now, we will keep the docker containers up and running
Step 7. Access Prometheus: open your browser and type: http://YOUR_IP:9090/targets
Step 8. Access CAdvisor: open your browser and type: http://YOUR_IP:8080/docker
Step 9. Access Grafana: open your browser and type: http://YOUR_IP:3000 Now you are accessing Grafana graphic interface. Click on Configuration then, Add data source, and add the data source
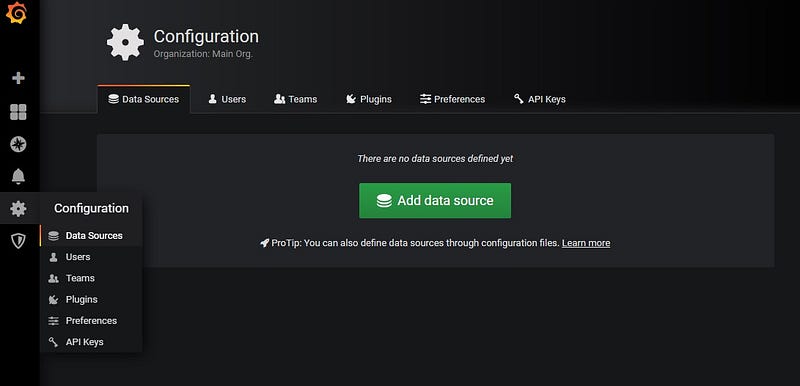
Search Prometheus and then press Select. A new window will open
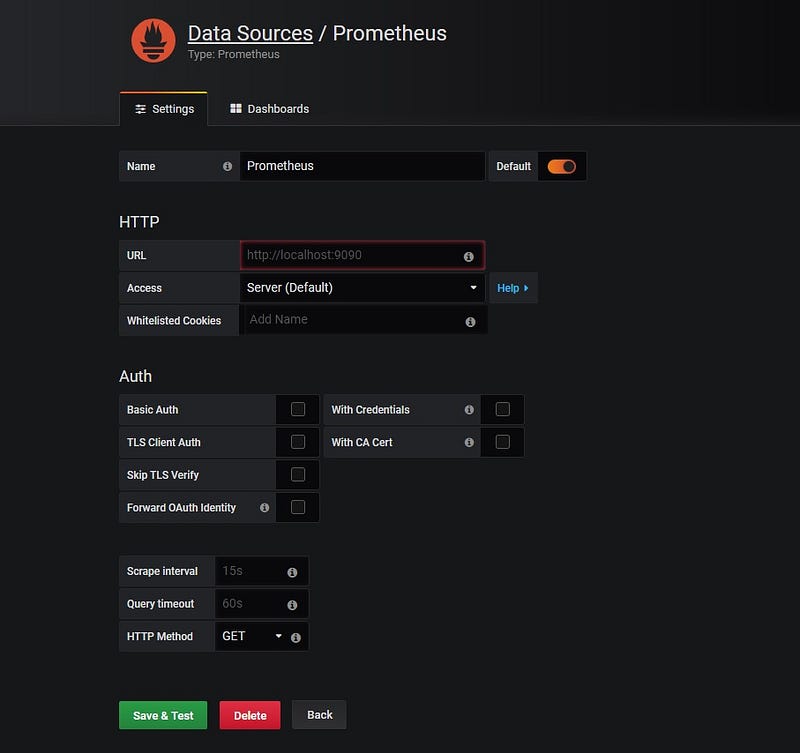
Add to URL: http://YOUR_IP:9090/ then press Save & Test
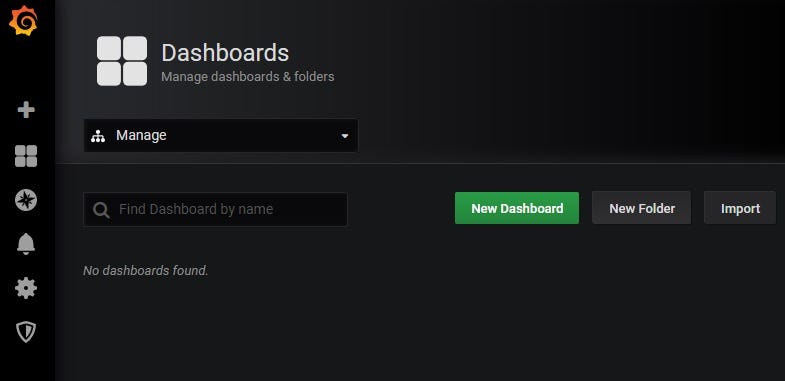
Now go to Dashboards / Manage and press Import
Now access https://grafana.com/grafana/dashboards. Here you will find a list of community Dashboards and you can choose the best one for your purposes.
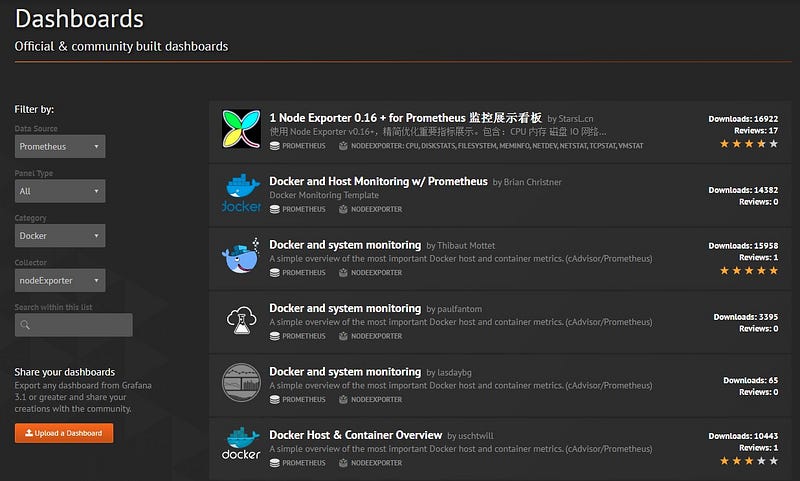
Our recommendation is to use the Dashboards with the ID 193, 3395, 1860
Step 10. At the Import window, add 193 in the Dashboard ID and press Load.
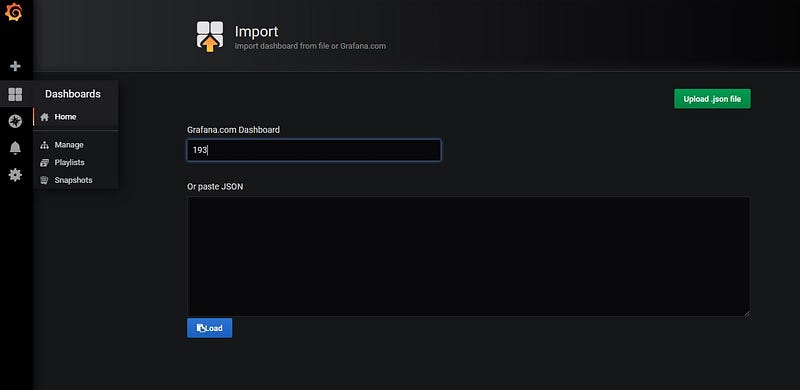
A new window will be open. In Options / Prometheus, select your data source from step 9, named Prometheus.
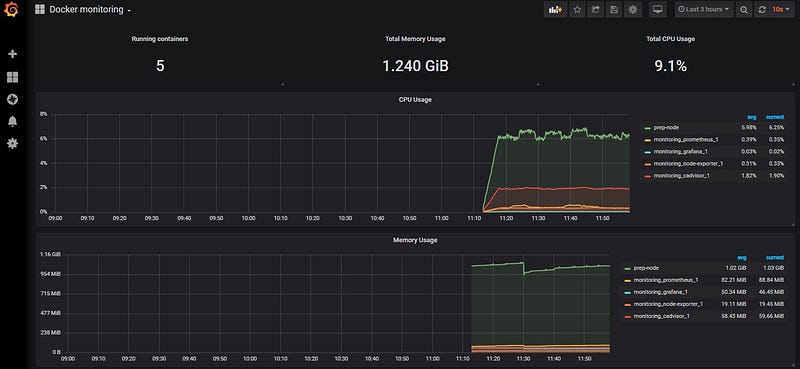
Now your Dashboard should look like this.
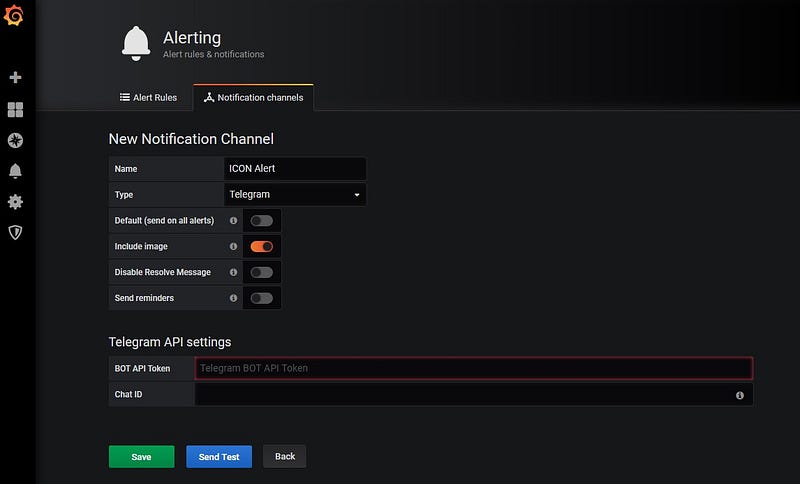
Step 11. Create an alert. Click on the bell from the left, choose Notification Channels, and then click on New Channel. Add Name (e.g. “ICON Alert”), choose Telegram for type, and add BOT API Token and Chat ID. Click Save.
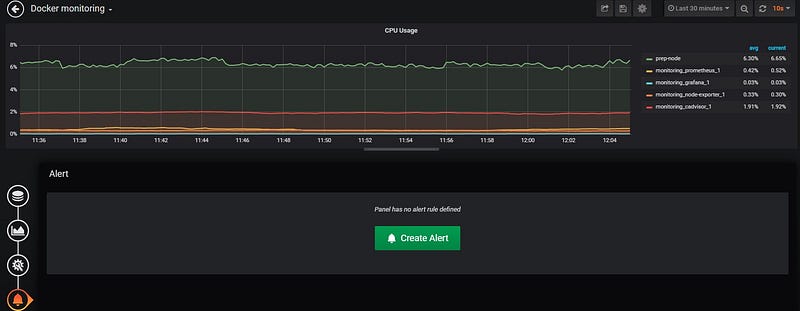
Now go to your Dashboard. Click on the CPU Usage window and select Edit from the drop-down menu. Click on the Create Alert button with the bell.
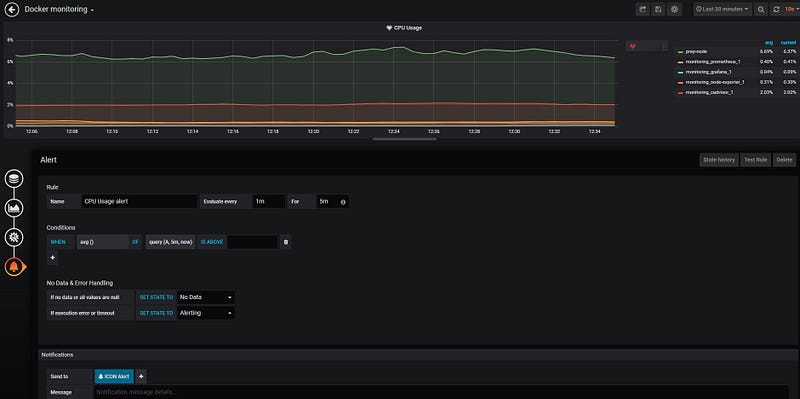
A new window opens, where you can setup the alert conditions. Under Notifications, you should see ICON Alert. Save the Dashboard.
Step 12. For text notification on your mobile phone, you can create a new Notification Channel and use OpsGenie or PagerDuty.
Option 2 for the alerting system
An alternative option for an alerting system is to use a Telegram Bot Channel. One of the easiest to use is ICON-botnotificator, which uses Telegram for notification.
Step 1. Set up a Telegram bot. Search on Telegram: BotFather, send to it: /newbot and follow the instructions. Now you should have the token access that has a format that looks like this: 111111111:AAAAAAAAAAAAAAAAAAAAAAAAAAAAAAA
Step 2. To get your chat ID run @userinfobot
Step 3. Edit config.ini with the info from Step 1 and 2 and add your ICON node IP
Step 4. Install curl and jq
$ sudo apt-get install curl jqStep 5. To run the script.
$ sudo ./notifier.sh4.Conclusion
Node uptime is critically important for all P-Reps. Monitoring and alerting systems help achieve higher uptime by letting the node owners know when there are issues. This article presents a few solutions that our team has implemented. This is only a small part of what Prometheus and Grafana can do. UBIK Capital is planning to develop our own ICON Dashboard for Grafana and to integrate more options into our Dashboard.
If you have any questions please contact us: contact@ubik.capital or on Telegram channel: ubikcapital. Follow us on Twitter: @ubikcapital